Updated February 2024
Google uses the page experience as part of their ranking algorithm, making it yet another factor to keep on top of to achieve a high position in the search results.
Google have grouped these under the title of Core Web Vitals, to provide a snapshot health-check of your site – but crucially it can use real visitor data.
What are Core Web Vitals?
Core Web Vitals are metrics introduced by Google to measure real-world usage of a visitor’s experience on a webpage. They comprise three primary measurements that are used to calculate the speed of the page and user interaction.
The Core Web Vitals are:
- Largest Contentful Paint (LCP)
- Cumulative Layout Shift (CLS)
- First Input Delay (FID)
- Interaction to Next Paint (INP) – Introduced March 2024
Not exactly snappy titles and not immediately obvious what they are. Strap in, here we go:
Largest Contentful Paint (LCP)
Largest Contentful Paint is simply the measurement of how long it takes a page-view to load for a real site user. So, from the point of clicking a link to seeing the site on your screen, Google tells us this should happen in under 2.5 seconds.

To analyse LCP, Google takes the largest content piece (be it text, video or image) to appear on the display. As the page changes in loading, Google shifts to the new main element. It progresses until when the page loads fully or the user starts interacting with the page. There are several elements that that can impact the loading speed, but the main factors for enhancing LCP include:
- Removing any third-party scripts that aren’t needed,
- Removing render-blocking code that stops other content from showing properly
- Upgrading your website hosting
- Configuring lazy loading – only loading elements when they are needed to be viewed on screen
- Removing large page components
- ‘Minifying’ your CSS – compressing it down so it loads very quickly
LCP is primarily going to be impacted by how your site was built in the first place, or what content you’ve added to it since, but from a site owner’s point of view making sure that images are correctly compressed for web use is important, either before uploading to the site or making sure the site itself is applying compression.
Cumulative Layout Shift (CLS)
Cumulative Layout Shift calculates the visual stability of a page as it loads. Layout shift, also known as ‘layout jank’, appears when the information on the page keeps moving around despite the page appearing loaded. This is annoying, and can sometimes result in a user clicking the incorrect link.
The CLS score is calculated through multiplication of the display part that changed when loading by the interval it moved. Google’s recommendation is a score under 0.1, so only minimal elements move as the page loads.

Again, layout shift is going to be mainly influenced by how the site was originally built.
First Input Delay (FID)
Largest Contentful Paint measures if the page is viewable. First Input Delay measures whether a user can interact with the page, such as clicking a link. Often a page can be viewable, but due to the loading of other items happening off-screen you can’t interact with the page.
Longer input delays tend to happen when the page is in the loading process and part of the content is already viewable but expecting to be interactive, since the browser is fully engaged in loading the remaining part of the page. The primary effort on developing FID is concentrated on quicker page loading.
Google rates a score under 100 milliseconds as Good for FID.

Implementing a site cache (such as Cloudflare) and reviewing slow 3rd party JavaScript can rapidly reduce your first input delay score.
Interaction to Next Paint (INP)
From March 2024, Google will be using Interaction to Next Paint (INP) instead of FID (First Input Delay). INP assesses the responsiveness of using a webpage, such as clicking or a key press, and how long it takes for the user interface to update. When an interaction causes a page to become unresponsive, that is a poor user experience. INP observes the latency of all interactions a user has made with the page, and reports a single value which all (or nearly all) interactions were below. A low INP means the page was consistently able to respond quickly to all—or the vast majority—of user interactions.

Find Your Vitals
PageSpeed Insights
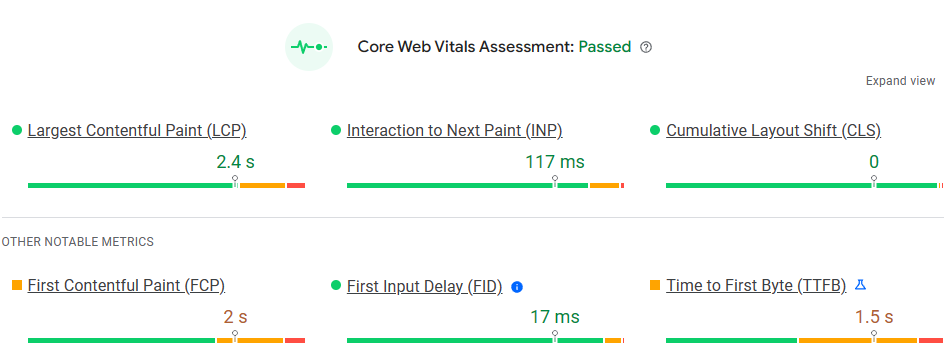
The easiest way to view your vitals is via Google’s PageSpeed Insights. In the results, some sites will have a Field Data section, but this is usually only for larger sites.

If Field Data isn’t shown, you can still see a snapshot underneath from Lab Data. Note that running the report multiple times for the same page can get different results.

Google Search Console
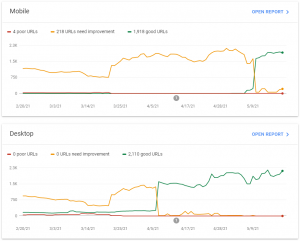
For a more detailed view of Core Web Vitals, you will need to access Google Search Console. This will provide a graph of the number of pages with issues or improvements required over time, split between mobile and desktop.

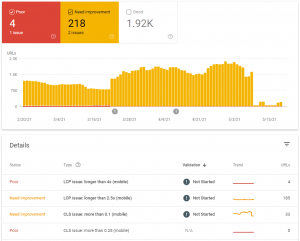
Selecting the Open Report against these graphs then allows you to see what the issues relate to. Selecting any of the Types in the details section will show which pages are affected.

Google PageSpeed Scoring
Google uses PageSpeed Insights as a tool for testing website performance.
A Google PageSpeed Score typically ranges from 0 to 100 with a higher score indicating better performance. The score is calculated based on how a page performs in terms of various performance metrics. The specific algorithm and weightings may change over time, but it generally takes into account factors like page load times, content rendering, and interactivity.
The PageSpeed Score is often linked to the user experience. A higher score usually correlates to faster loading and better user experience. Google and other search engines consider page speed and user experience when ranking pages in search results, so a better score can lead to improved search engine ranking and user engagement.
An overall Speed score is calculated by looking at the categories for each metric:
- Fast: The median value of the metric is in the fastest third of all page loads (If every metric of a page/origin is Fast)
- Slow: The median value of the metric is in the slowest third of all page loads (If any metric of a page/origin is Slow)
- Average: The median value of the metric is in the middle third of all page loads (All other cases)
Summary
We could equate Core Web Vitals to emissions tests during your car’s MOT. It’s measuring multiple areas all designed to improve the quality of the environment or in this case the internet. As Core Web Vitals are now being used by Google as part of their ranking algorithm, for those sites wishing to stay on top of their search engine positions it’s going to be important to monitor them and make sure that your site stays in tip-top condition.


